The SNAP maximum monthly allotment is the ceiling the federal government will pay to a household with zero countable income. It is the number everyone wants to know first, because it tells you the most your EBT card could possibly load each month.
For fiscal year 2026, which runs October 2025 through September 2026, that ceiling ranges from $298 for a single person to $1,789 for an eight-person household in the 48 contiguous states and the District of Columbia.
This guide gives you the full chart with every household size from one to eight, explains how the marginal amounts work for households larger than eight, and shows why your actual benefit is almost always below the ceiling.
If you want to skip straight to estimating your real monthly benefit instead of just the ceiling, you can use the free SNAP eligibility calculator on our homepage and get a number in about 90 seconds.
Table of Contents
- 12026 SNAP Maximum Monthly Allotment Chart (48 States & DC)
- 2Full Reference Table: All Six Numbers That Matter
- 3How the Maximum Allotment Becomes Your Actual Benefit
- 4Why Your Benefit Is Almost Always Below the Chart Ceiling
- 5Alaska, Hawaii, Guam, and the U.S. Virgin Islands Have Higher Allotments
- 6How the 2026 COLA Changed the Chart
- 7How Household Size Is Counted for the Chart
- 8How to Convert the Chart Into Your Actual Monthly Estimate
- 9What to Do If Your Benefit Is Below the Chart Maximum
- 10Frequently Overlooked Chart Details
- 11Frequently Asked Questions
- 12Wasim Akram
2026 SNAP Maximum Monthly Allotment Chart (48 States & DC)
Here is the full chart for fiscal year 2026. These numbers apply to every household in the 48 contiguous states and the District of Columbia. Alaska, Hawaii, Guam, and the U.S. Virgin Islands have higher amounts, which we cover further down the page.
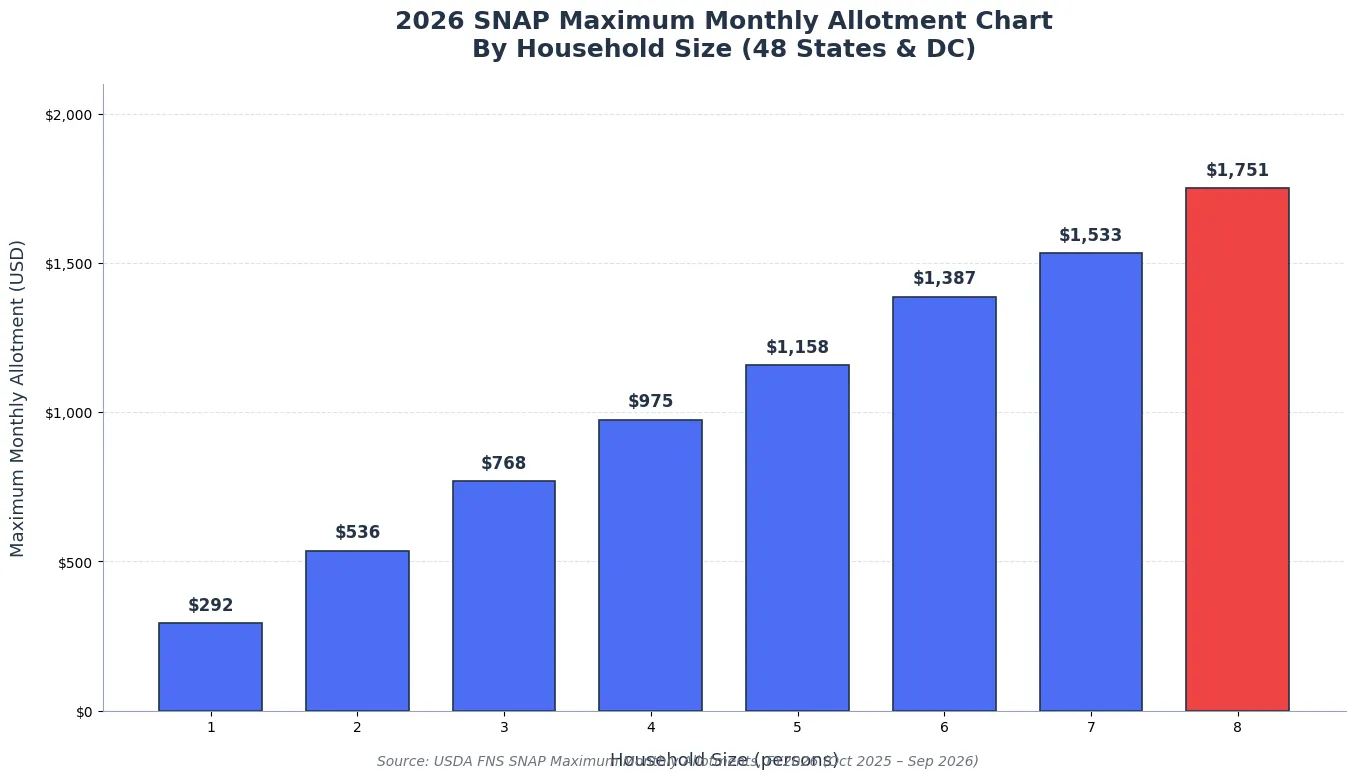
The chart shows eight discrete bars, one for each household size from one to eight people. The amounts rise as household size grows, but not in a perfectly linear way. The jump from one person to two is $244, while the jump from six people to seven is only $146. The marginal amounts fluctuate based on the Thrifty Food Plan re-costing, which is recalculated each year using grocery price data.
For each additional person beyond eight, add $220 to the maximum allotment. So a household of nine has a maximum of $1,976 per month, a household of ten has $2,196 per month, and so on. There is no upper limit on household size in the SNAP program. Your caseworker will calculate the exact maximum for very large households using the federal adjustment formula in the USDA handbook.
Full Reference Table: All Six Numbers That Matter
The chart above shows only the maximum allotment, but SNAP has six key numbers per household size. The full reference table below shows the gross income limit, the net income limit, the maximum allotment, the standard deduction, and the asset limit (which only applies in states that have not adopted BBCE) for every household size from one to eight.
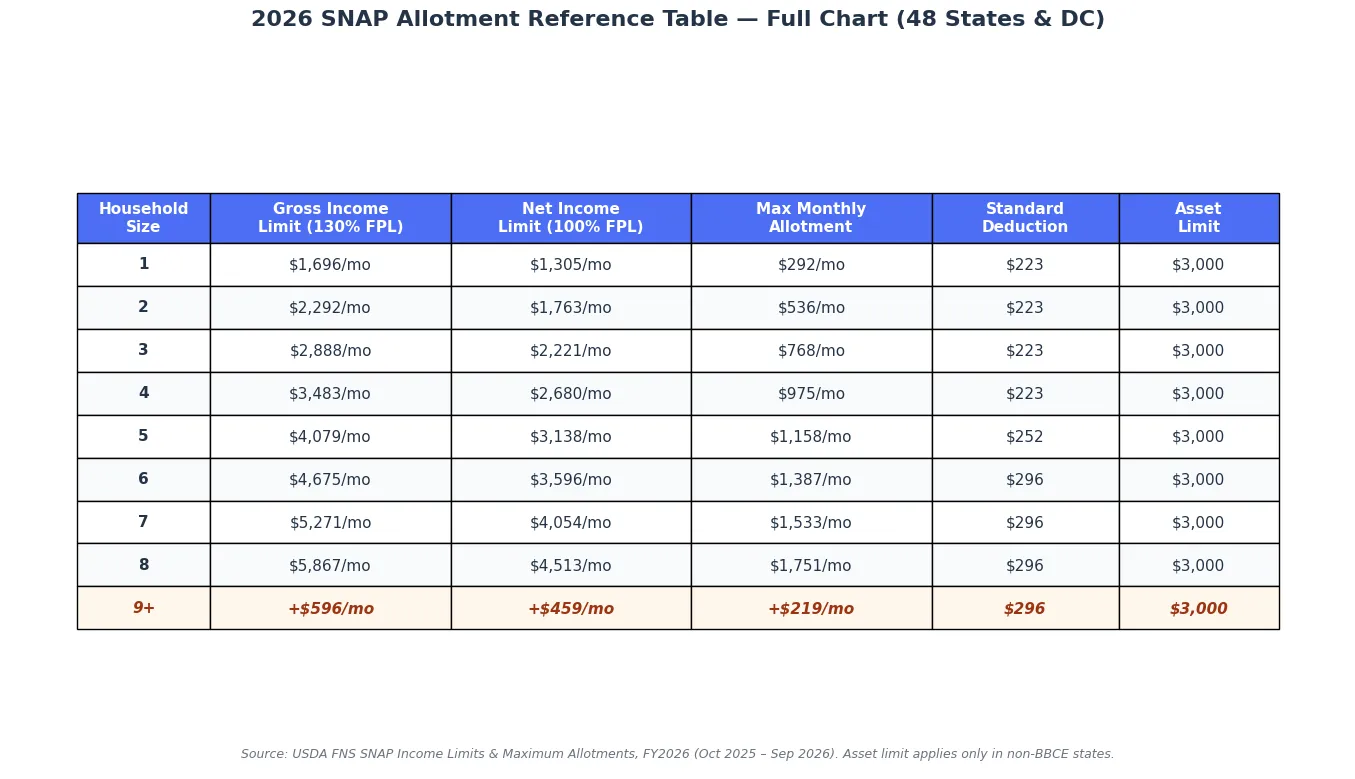
The gross income limit is 130 percent of the federal poverty line. It is the first test you must pass to qualify for SNAP. The net income limit is 100 percent of poverty, and it is the second test, applied after deductions.
The maximum allotment is the ceiling benefit. The standard deduction is automatic and applied to every household. The asset limit only matters in the handful of states that have not adopted BBCE, which waives the asset test entirely.
If you want the full explanation of how these numbers fit together, our SNAP income limits reference page walks through the gross and net income tests in detail. For now, the key takeaway is that the chart shows the ceiling, not your actual benefit. To estimate your actual benefit, you need to know your countable net income, which is what we cover next.
How the Maximum Allotment Becomes Your Actual Benefit
The maximum allotment is the starting point, not the ending point. SNAP uses a four-step formula to convert the maximum allotment into your actual monthly benefit. The formula is the same in every state, and it always produces a number that is less than or equal to the chart maximum.
Step one is the gross income test. Your gross monthly income must be under 130 percent of poverty for your household size. The numbers in the table above are the cutoffs. If your state has BBCE, the gross limit jumps to 200 percent of poverty, which is roughly $2,506 for one person and $5,182 for a family of four. About 40 states use BBCE.
Step two is calculating your net income. Start with your gross income and subtract the standard deduction, the 20 percent earned income deduction, and any shelter, medical, dependent care, or child support deductions you qualify for. Your net income is what is left. If you want every deduction broken down with the paperwork you need, our SNAP deductions cheat sheet has all seven with examples.
Step three is finding your 30 percent share. Multiply your net income by 0.30. That is the amount SNAP expects you to spend on food yourself. If your net income is $1,000, your share is $300.
Step four is the final subtraction: take the maximum allotment from the chart, subtract your 30 percent share, and the result is your monthly SNAP benefit. If your share is bigger than the maximum, your benefit is zero.
If you want to see a worked example with real numbers, our SNAP benefit calculator guide walks through the formula step by step for a family of three earning $2,400 a month, ending with a $475 monthly benefit. The same math applies to every household size, just with different chart maximums.
Why Your Benefit Is Almost Always Below the Chart Ceiling
Most SNAP households receive less than the maximum allotment for their size. The chart shows the ceiling, and four things push your actual benefit down from that ceiling. Understanding these four factors helps you predict your real monthly amount and spot a short deposit if your caseworker makes a mistake.
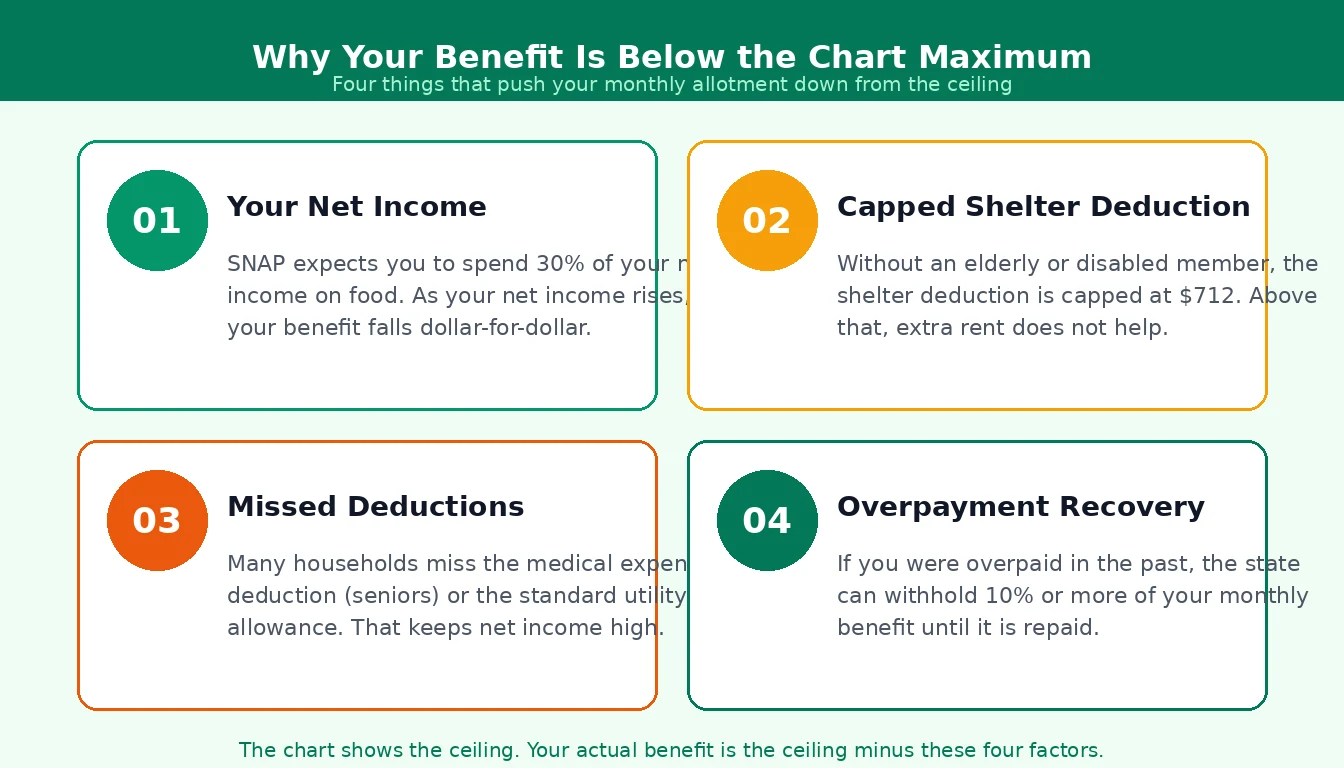
The first factor is your net income. SNAP expects you to spend 30 percent of your net income on food, so as your net income rises, your benefit falls dollar-for-dollar. A household of four with $1,000 in net income would get $994 minus $300, which is $675 per month. A household of four with $2,000 in net income would get $994 minus $600, which is $375 per month.
The second factor is the shelter deduction cap. For households without an elderly or disabled member, the excess shelter deduction is capped at $712 per month for fiscal year 2026. If your rent is $1,500 a month, you can only deduct $712 of it, even though your actual shelter cost is much higher.
This cap is the single biggest reason high-rent households in cities like New York and San Francisco do not get the maximum allotment. Households with an elderly or disabled member have no cap, which is why seniors in high-rent areas sometimes receive the full chart maximum. Our SNAP and housing guide covers this in detail.
The third factor is missed deductions. Many households do not claim every deduction they qualify for, which keeps their net income artificially high. The most commonly missed deduction is the medical expense deduction for seniors and disabled households, which can be worth $50 to $170 per month.
The second most commonly missed is the actual utility allowance, which can be higher than the standard utility allowance if you live in a cold-climate state with high heating bills. Our medical expense deduction guide lists every qualifying expense.
The fourth factor is overpayment recovery. If you were overpaid SNAP in the past, the state agency can withhold 10 percent or more of your monthly benefit until the overpayment is repaid.
This withholding happens automatically and is one of the most common reasons a household's benefit is lower than the calculator predicts. Our SNAP overpayment guide explains what to do if the agency claims you were overpaid.
Alaska, Hawaii, Guam, and the U.S. Virgin Islands Have Higher Allotments
The chart on this page applies to the 48 contiguous states and the District of Columbia. The four outside jurisdictions run on higher allotments because groceries cost significantly more there. If you live in one of these places, you should use the higher local chart, not the continental one.
Hawaii's maximum allotment runs about 25 percent above the continental standard. A single person in Hawaii can receive up to about $365 per month, and a family of four can receive up to about $1,219 per month. The income limits are the same as the rest of the country, but the allotment ceiling is higher.
Alaska has the most variation, with three rural sub-regions getting allotments 60 percent or more above the continental standard, plus separate urban figures for Anchorage and Fairbanks.
A single person in rural Alaska can receive up to about $467 per month, and a family of four in the same region can receive up to about $1,561 per month. The exact figure depends on which of Alaska's three regions you live in.
Guam and the U.S. Virgin Islands get a smaller bump, generally running 15 to 25 percent above the continental standard. The 2026 COLA applies to all four jurisdictions, but the dollar figures are different. If you live in one of these places, ask your local SNAP office for the 2026 fact sheet rather than relying on the continental chart.
How the 2026 COLA Changed the Chart
The chart on this page reflects the fiscal year 2026 numbers, which took effect October 1, 2025. The October 2025 SNAP cost-of-living adjustment kept maximum allotments essentially flat compared to fiscal year 2025. A single person still gets up to $298 per month, and a family of four still gets up to $994 per month.
The reason the chart barely moved is that the maximum allotment is tied to the Thrifty Food Plan, which is recalculated each year using grocery price data from the prior year.
Food inflation cooled significantly during 2024 and 2025 after the big run-up of 2022 and 2023, so the re-costing of the food basket barely moved. The big jumps you remember from 2023 and 2024 came from much higher food inflation in the years before that.
While the maximum allotment stayed flat, the income limits rose about 3.3 percent, the standard deduction went up modestly, and the excess shelter deduction cap rose from $672 to $712 per month.
These changes mean slightly more households qualify and slightly more deductions are available, even though the chart ceiling did not move. For the full breakdown of what changed and what did not, our 2026 SNAP COLA guide walks through every number.
How Household Size Is Counted for the Chart
The chart is based on SNAP household size, which is not always the same as the number of people living in your home. A SNAP household is everyone who lives together and shares food. The rule is about shared meals, not shared walls.
Spouses who live together are always one household. Parents and children under 22 who live together are one household. Adult siblings over 22 who live together but buy and prepare food separately can be separate households.
Roommates who do not share meals are separate households. An elderly parent who lives with you can be a separate household if they buy and prepare food separately, which can be advantageous if their income and medical expenses would otherwise drag down your household benefit.
If you have a child in joint custody, the child counts as a household member for the parent who provides more than half of the child's meals during the month. The other parent cannot also claim the child.
If custody is exactly 50/50, most states default to the parent who applies first or who claims the child on their taxes. Our joint custody and shared households guide walks through every scenario.
Getting your household size right is critical because it determines which row of the chart applies to you. Reporting it wrong can swing your benefit by hundreds of dollars. If you are not sure how to count your household, our SNAP application guide walks through every common living arrangement with examples.
How to Convert the Chart Into Your Actual Monthly Estimate
The chart shows the ceiling, but most people want to know what their actual benefit will be. The fastest way to find out is to use our free SNAP eligibility calculator, which runs the four-step formula for you in about 90 seconds using the current 2026 numbers. If you want to do the math by hand, here is the shortcut.
Find your household size in the chart and note the maximum allotment. Then calculate your countable net income, which is your gross income minus the standard deduction, minus the 20 percent earned income deduction, minus the shelter deduction, minus the medical expense deduction if applicable, minus any other deductions you qualify for.
Multiply your net income by 0.30 to find your 30 percent share. Subtract your share from the maximum allotment, and the result is your estimated monthly benefit.
If your share is bigger than the maximum allotment, your benefit is zero. This happens when your net income is high enough that SNAP expects you to spend more on food than the maximum allotment covers.
For a single person, the break-even net income is about $993 per month, because 30 percent of $993 is $298, which equals the maximum allotment. Above that net income, the benefit is zero. For a family of four, the break-even net income is about $3,483 per month.
If your estimate comes out very different from what your caseworker eventually approves, the most likely cause is a deduction mismatch. Compare the deductions applied on your approval letter to the deductions you used in your estimate, and if your caseworker missed one, ask them to add it. You have 90 days from the date of the decision to request a fair hearing if your benefit is wrong.
What to Do If Your Benefit Is Below the Chart Maximum
If your benefit is below the chart maximum, the first thing to do is figure out why. Most of the time, the reason is simply that your net income is above zero, which is normal and expected. The chart shows the ceiling for zero-income households, and most SNAP households have some income. A benefit of $200 to $400 per month for a working household is typical.
If your benefit is much lower than expected, look at your approval letter and check the deductions your caseworker applied. The most common reason for a too-low benefit is a missed deduction, especially the medical expense deduction for seniors or the actual utility allowance for households with high heating bills.
Bring the supporting paperwork to your caseworker and ask them to update your case. SNAP rules require them to apply every deduction you qualify for and can verify.
If your benefit suddenly drops from one month to the next, the cause is usually a change in your income, a change in your household size, a missed recertification, or an overpayment recovery.
Our guide to why SNAP benefits go down walks through all ten common reasons and tells you what to do about each one. The COLA that takes effect every October can also change your benefit, but the October 2025 COLA was small enough that most households saw no change or a change of less than $10 per month.
Once you are approved, your benefit loads on the same day every month. The deposit day is set by your state using your case number, last name, or Social Security number. If you are not sure what day your benefits will load, our SNAP payment schedule by state guide lists the rule every state uses and how to find your exact deposit day.
Frequently Overlooked Chart Details
A few chart details trip people up regularly. The first is that the chart maximum is per household, not per person. A two-person household does not get $584, which would be $298 times two.
A two-person household gets $546, which is less than double the single-person amount. The marginal amount per additional person shrinks as the household grows, then jumps back up at certain sizes due to the Thrifty Food Plan re-costing.
The second detail is that the chart applies to your SNAP household, not your tax household or your lease household. If you have a roommate who you split rent with but do not share meals with, they are not part of your SNAP household.
If you have a parent who lives with you and shares your meals, they are part of your SNAP household even if they have their own income. The rule is about shared food, not shared space.
The third detail is that the chart maximum is the same every month for the entire fiscal year. You do not get a different amount in different months unless your income, household size, or deductions change.
If your caseworker tells you your benefit will change next month and none of those things have changed, ask why. Our EBT balance checking guide shows you how to verify your monthly deposit through your state's online portal.
The fourth detail is that the chart applies only to the 48 contiguous states and DC. If you live in Alaska, Hawaii, Guam, or the U.S. Virgin Islands, your chart is higher. If you are planning to move to or from one of these jurisdictions, your benefit will be recalculated using the new location's chart. Our guide to moving SNAP across state lines covers what happens when you relocate.
The fifth detail is that the chart is the ceiling, not the floor. SNAP benefits are not guaranteed to be close to the maximum. The average SNAP household receives about $210 per person per month, which is well below the chart maximum.
Households with no income get the maximum. Households with income get less. The chart tells you the most you could possibly receive, and the formula tells you what you actually will receive.
Frequently Asked Questions